What Do We Really Know about Phone Surveying in Low- and Middle-Income Countries?
Phone surveys have long been a part of social science research in higher-income countries. In low- and middle-income countries (LMICs), researchers studying global poverty have historically relied on face-to-face surveys. As mobile phone ownership continues to become more ubiquitous in these settings, researchers have tentatively begun to use phone surveying. With the pandemic halting nearly all in-person data collection, there is suddenly intense demand from researchers to understand more about phone survey methods.
Some questions are especially relevant for implementation: What mode do I choose? Where do I obtain lists of phone numbers? What kind of response rates can I expect? How much will it cost to convert to phones? How representative are samples that target vulnerable populations that may not own mobile phones or have the means to maintain plans, connectivity, and power?
Working with Northwestern’s Global Poverty Research Lab, IPA has built resources to help researchers answer questions like these and more. As part of this effort, we reviewed the recent literature on mobile phone surveying in LMICs, producing an evidence synthesis and shorter briefs on pre-survey contacts and monetary incentives.
There are three approaches to obtaining phone number lists (sampling frames) for remote surveys:
- Random digit dialing (RDD) randomly generates numbers to match target countries’ mobile number formations.
- A mobile network operator (MNO), obtains a list of active numbers, which are then checked for activity and randomly sampled from all telecom customers.
- Existing samples can be used or created using sampling from face-to-face surveys and extended by providing handsets and SIMs to increase cell phone ownership.
Face-to-face household collection is not realistic during a global pandemic like COVID-19, so instead, depending on the IRB and consent, a list of numbers from a previous survey or program may be used. Sampling frames have dramatic effects on research protocols, representativeness, and response rates, as demonstrated by meaningful differences in the proportion of connected phone numbers. Looking across several studies, we found that interviewers were able to connect with 63 percent of numbers dialed from existing samples, on average, but only 19 percent of numbers from “cold call” samples (RDD and MNO)—See Figure 1.
Figure 1: Average proportion of connected numbers per unique number attempted by sample frame
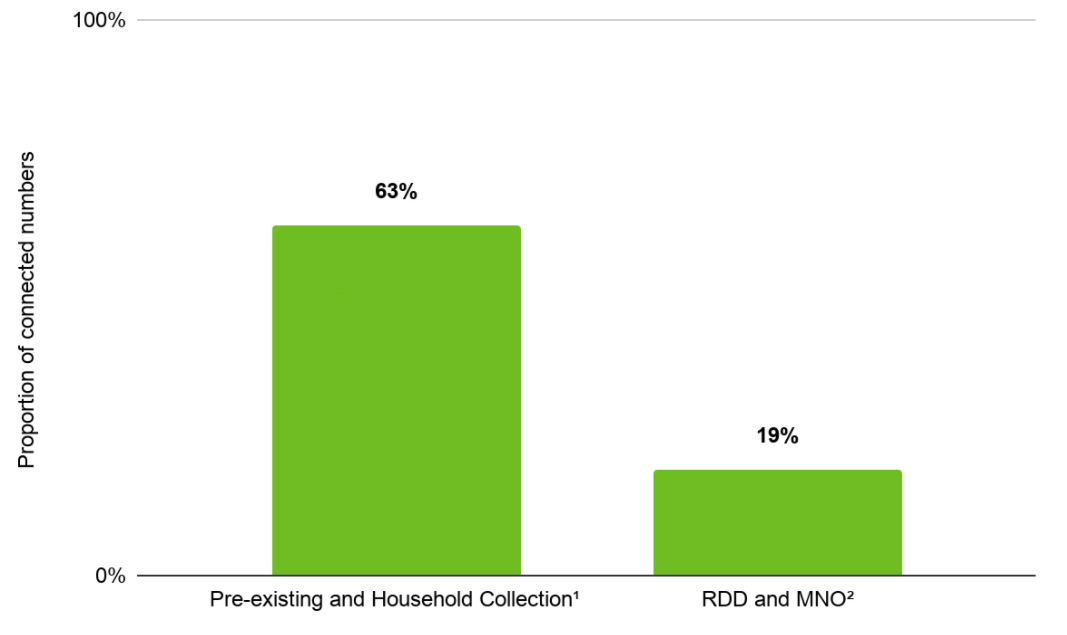
1 Lebanon; Liberia (a, b)2 Bangladesh (a, b); Ghana; Liberia; Mozambique; Philippines; Tanzania; Uganda; Zambia
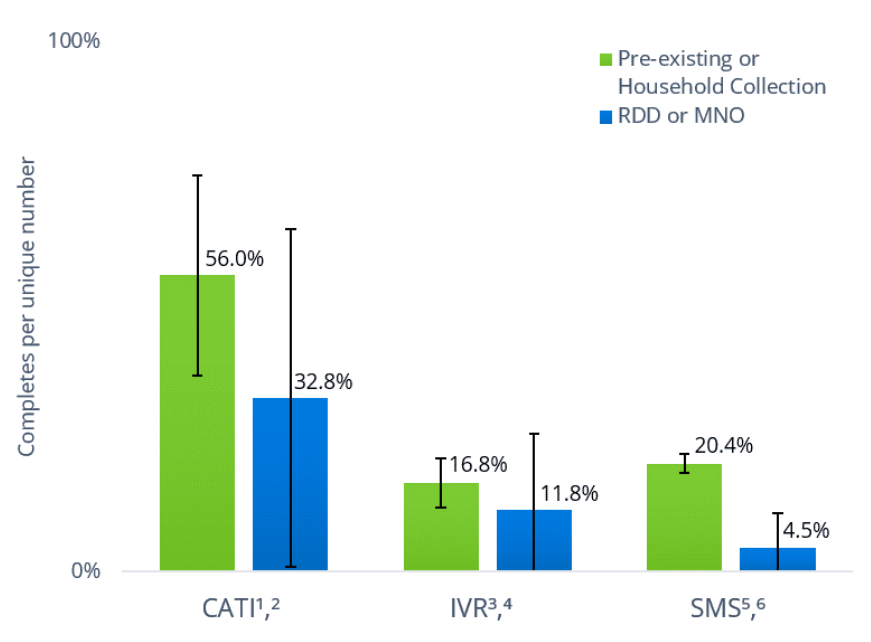
Though remote surveying is useful in emergency situations, such as the COVID-19 crisis, there is a reason face-to-face (F2F) surveying remains the standard for data collection in LMICs. F2F surveys, such as the Demographic and Health Survey (DHS) program rarely have response rates under 90 percent and are representative of the entire country. In comparison, response rates for remote surveys can range from 4.5 percent to 56 percent, depending on mode and sample type:
Figure 2: Response Rate by Mode and Sample Type
1 Ghana; Kenya; Lebanon; Liberia (a, b); Peru; Sierra Leone; Turkey
2 Australia; Bangladesh; Liberia; Mozambique; Nigeria; Tanzania3 India; Ghana; Malawi; Nigeria; Peru4 Afghanistan; Bangladesh (a, b); Ethiopia; Ghana (a, b, c); Liberia; Mozambique; Nigeria; Tanzania; Uganda; Zambia; Zimbabwe.5 Kenya; Peru6 Ghana; Kenya; Nigeria (a, b); Philippines; Uganda.
At most, remote surveys are representative of the population that owns or has access to a working, connected mobile phone. In the past 10 years, mobile phone subscriptions per 100 people have increased by 55 percent in IPA countries but is 29 percent less than OECD countries. Broad improvements in the representativeness of remote surveys may still rely on changing mobile penetration and ownership patterns. Though there is a gender gap in current mobile phone ownership, it is a reduction from previous years and there have been significant regional reductions in ownership and mobile internet use.
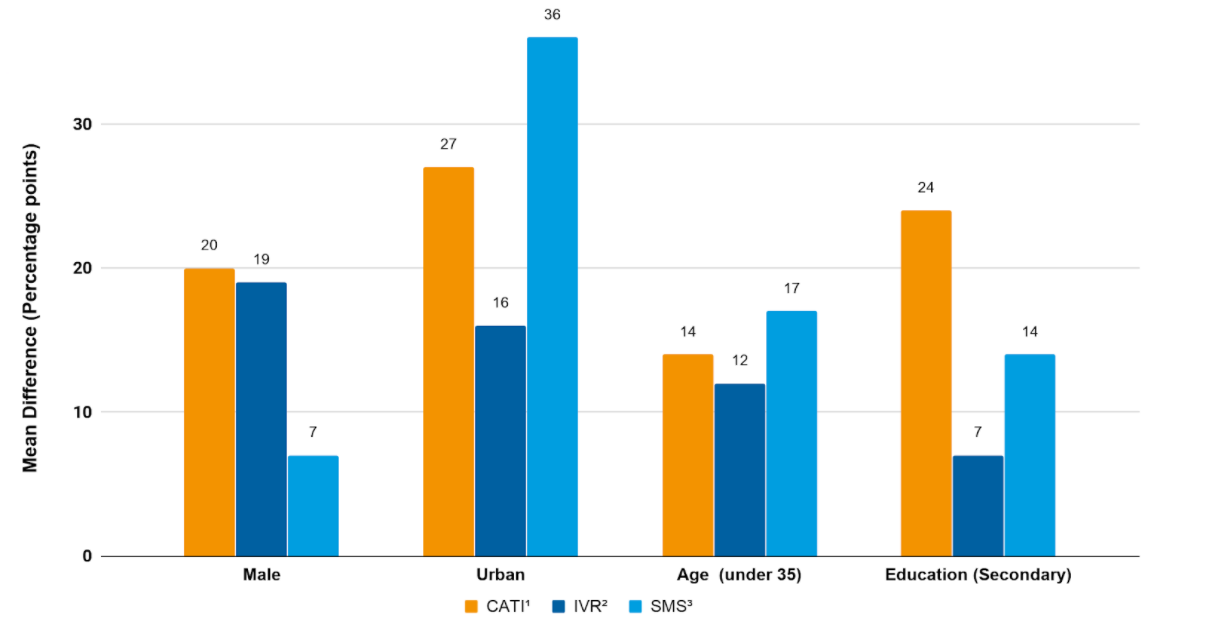
Historically, these disparities have been reflected in the sample compositions of phone surveys. Evidence from 15 studies in LMICs conducted between 2014-2019 across all remote modes found that samples over-represent urban, educated, young (below age 35) and male respondents. Figure 3 below shows these differences.
Figure 3: Representativeness of Remote Surveys Compared to Nationally Representative Surveys
1 Liberia; Nigeria2 Afghanistan; Ethiopia; Ghana; Mozambique; Nigeria; Zambia; Zimbabwe3 Ghana; Kenya; Nigeria (a, b); Philippines; Uganda
Although surveys may experience coverage bias, remote surveys are generally significantly less expensive than face-to-face surveys. One study found that face-to-face surveys were 161 percent the cost of CATI surveys when controlling for the number of items in the questionnaire. Other estimates found that a face-to-face survey averaged more than 10 times the cost per household of a remote survey. In the existing literature, estimated costs vary substantively by mode, with IVR being the cheapest mode and CATI the most costly per completed surveys.
Although historical evidence can help us implement phone surveys, new evidence on sample composition is needed due to rapidly changing trends in mobile phone ownership and use. This is why the GPRL-IPA Research Methods Initiative has been working to foster dissemination of lessons learned about implementation of surveys. Even as we return to face-to-face interviewing, the acceleration of new insights and expertise on phone surveys in LMICs gained during the pandemic will likely encourage the use of phone and multi-mode surveys in global poverty research.


