


Uncovering the True Costs of Mobile Money Services
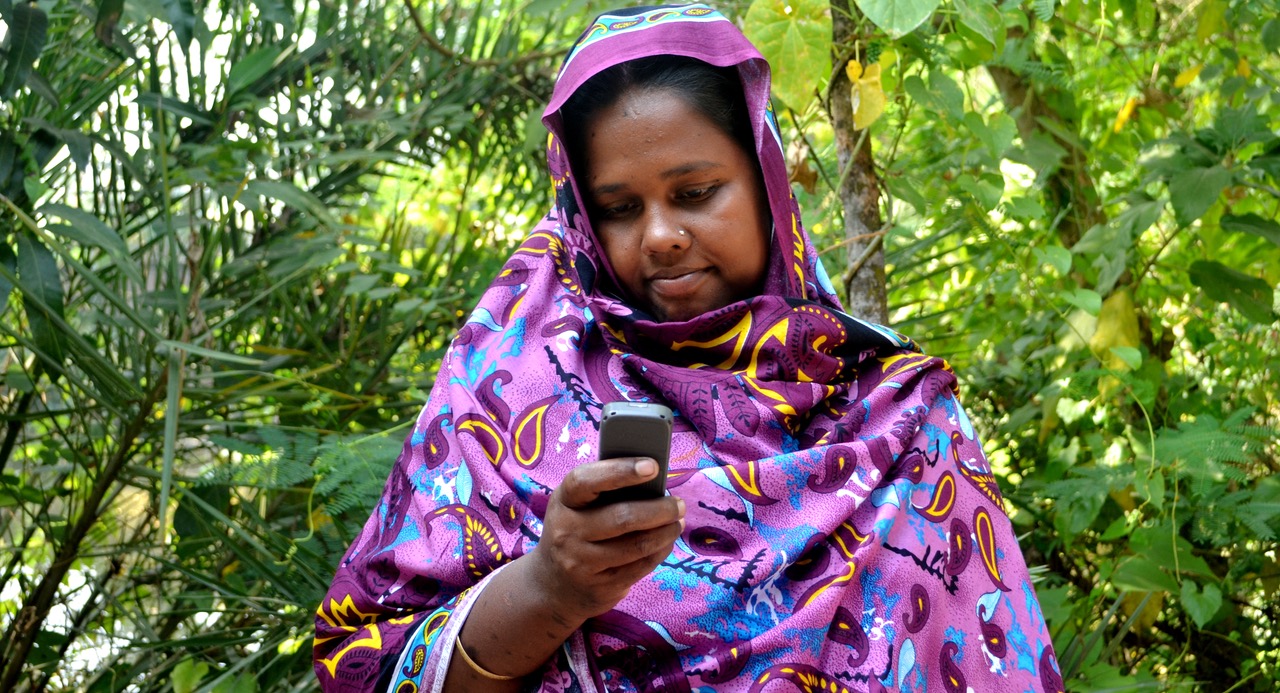
When Musa* first got a job in Dar es Salaam, Tanzania’s commercial capital, he would send money home by filling an envelope with cash and handing it to a bus driver headed towards his family’s rural home. Musa’s family would walk to the nearest bus stand and—if everything went according to plan—receive the cash when the bus arrived.
Things are easier now. Today, Musa can instantly send money right from his phone using mobile money, and his family can withdraw the cash using agents conveniently located nearby. Mobile money has dramatically altered how money is moved in many low- and middle-income countries (LMICs), allowing individuals to take higher-paying jobs in urban centers while easily remitting money back home, just one of the many ways that mobile money can lead to reductions in poverty.1
However, mobile money has a dirty little secret: while high-income countries have free or low-cost digital money transfer services like PayPal or Venmo, mobile money transactions in LMICs can be staggeringly expensive. When Musa sends 10,000 Tanzanian shillings home ($4, a typical transaction value in Tanzania), he pays 350 shillings and his family pays 1,552 to withdraw the funds.2In total, Musa and his family lose 19 percent of the transfer amount to fees and taxes. These costs create a significant financial burden for low-income consumers and hamper the growth of a potentially transformative product.
To measure the costs that Musa—and consumers like him across many LMICs—incur when using mobile money, Innovations for Poverty Action created the “Transaction Cost Index.” Results from the first year of IPA’s research on transaction costs were just published, including a comparison of prices across 16 countries in Africa, Latin America, and Asia, supplemented by fieldwork that explores hidden costs in Bangladesh, Tanzania, and Uganda. A new report lays out our findings, including comparisons of key costs in different countries and practical tradeoffs between data collection methods. Country briefs summarize costs and provide descriptive mobile money market data for the markets where we conducted fieldwork: Bangladesh, Tanzania, and Uganda. The report’s main findings include:
Prices vary considerably (if you can find them)
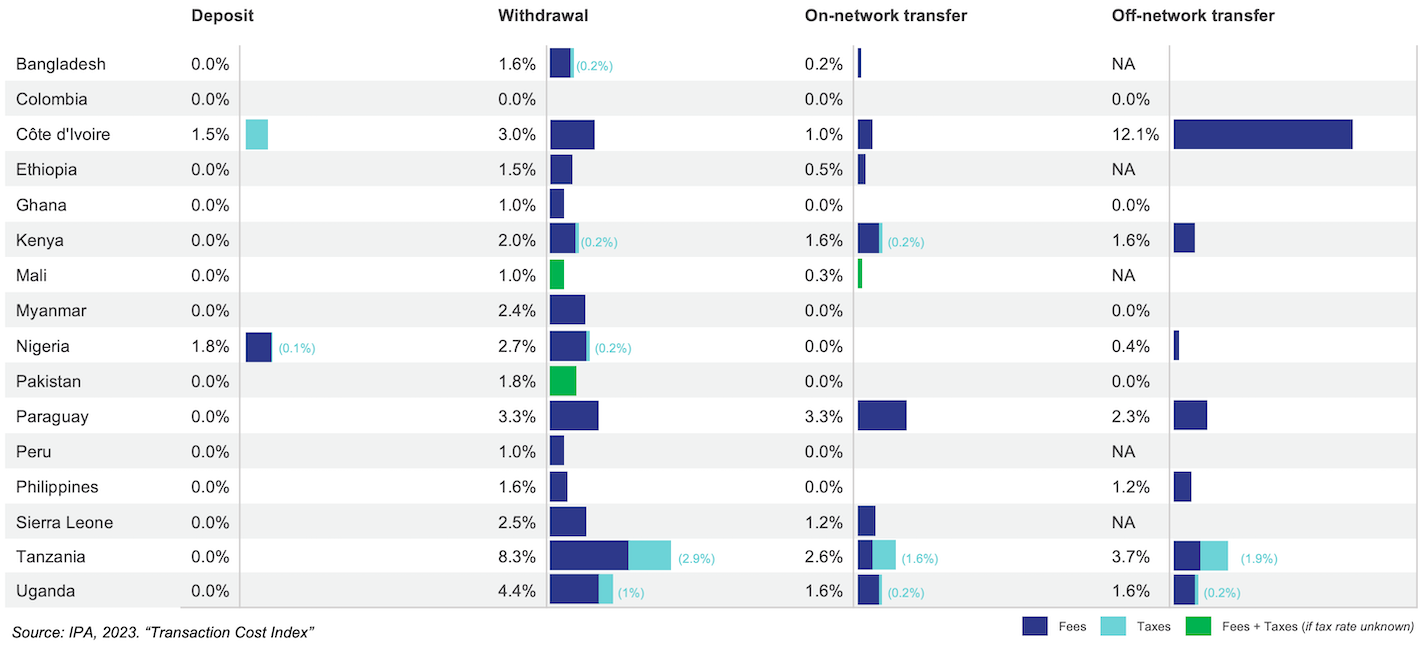
Depending on where Musa and his family live, the prices they pay for financial services would vary quite significantly; the same transfer that cost Musa and his family 19 percent of the transfer amount in Tanzania would be free in Colombia. We scraped pricing data from mobile money providers’ websites in 16 countries, allowing for comparison of fees and taxes. In most countries, consumers can deposit money into their accounts (“cash-in”) for free, but withdrawing (“cash-out”) can be quite expensive, with significant country variation. Off-network transfers—sending money between different mobile money providers’ accounts—are not universally available, and tend to be more expensive than transferring funds between accounts at a single provider (“on-network transfers”).
Fees as a percentage of transaction amount
Fees are displayed by country and transaction type. Where available, total fees are separated into direct provider fees and government taxes.3
We also measured how easy (or difficult) it is for consumers to see providers’ prices. While 86 percent of providers posted their prices online, 40 percent did not provide a link to their price list on their homepage.
Costs go beyond what’s listed on price sheets
When Musa’s family withdraws the cash they’ve been sent, they are likely to face additional costs beyond official provider fees, including informal extra fees charged by agents and difficulty in completing transactions successfully.
In Bangladesh, Tanzania, and Uganda, we monitored for these types of hidden costs by conducting intercept surveys of consumers outside agent locations and carrying out “mystery shopping” visits where enumerators or local consumers conducted real transactions with agents and then recorded key outcomes, including whether the transaction was completed and what fees were paid.
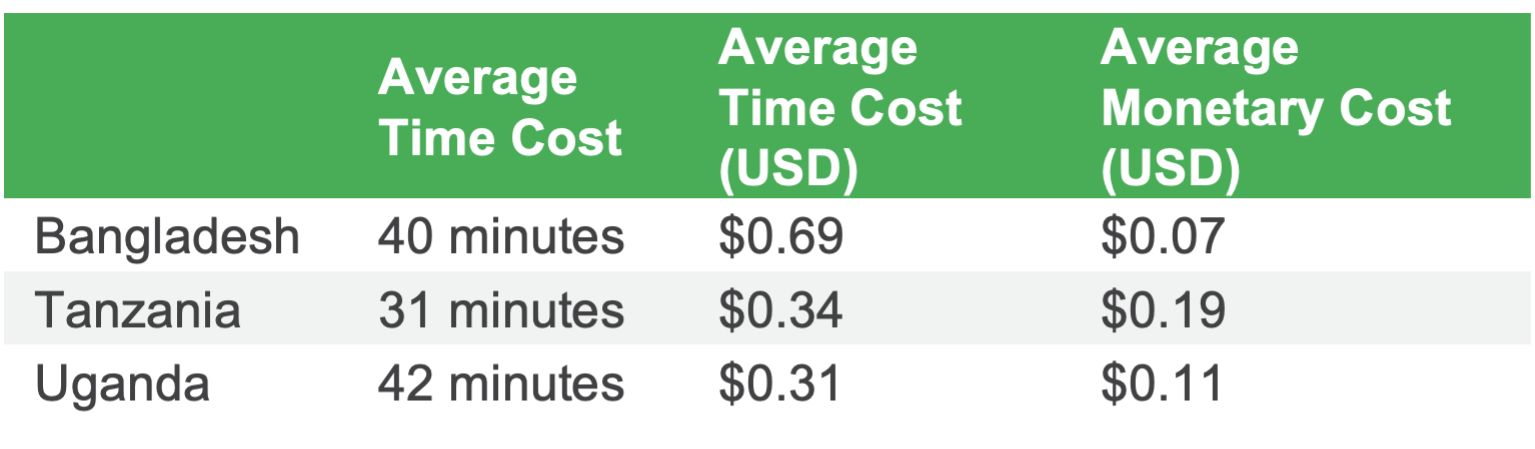
When consumers like Musa use agents to withdraw funds from their mobile money wallets in Tanzania, they have a 19 percent chance of being charged extra, unofficial fees. We recorded overcharging on 18 percent of withdrawals in Bangladesh and 11 percent of withdrawals in Uganda. Additionally, agent locations are not consistently staffed, with agents recorded as absent about a quarter of the time in Tanzania. Even when they are present, 12 percent of attempted transactions are not successful (most commonly because agents lack the funds to complete the transaction). In total, about one-third of agent visits do not result in a completed transaction, meaning consumers’ time is often wasted as they reattempt transactions at alternate times or with different agents. The story is similar in Bangladesh and Uganda, where 28 and 39 percent of attempted transactions did not succeed, respectively (including cases where the agent was absent and when transactions failed).
In fact, the time associated with making successful transactions is several times larger than the direct financial costs of those transactions, when agent presence and transaction failures are taken into account. This suggests that improving agent presence and transaction reliability could be important ways to reduce the non-financial costs of transactions.
Diving deeper and looking toward the future
Our report covers all this in greater depth, plus much more: a comparison of methods used to measure hidden consumer costs, disaggregation of results by gender and geography, and a review of regulatory policies related to mobile money pricing. We’ve also created an interactive dashboard that allows you to explore provider prices in detail and published our data for those who want to do an even deeper dive into our results. We’ll be hosting a webinar on September 28 to discuss these findings and their policy implications—register here! Stay tuned in the coming months for additional blogs that will look more closely at some of our most interesting findings.
Ultimately, we hope this work serves as a launching pad for a larger effort in a broader set of countries to systematically measure the costs consumers face when using digital financial services, and we’re excited to share what we’ve learned about how to measure these costs effectively. Do you want to know how mobile money costs stack up in your country? Do you have ideas on how these costs should be measured, or how to make mobile money more affordable? We’d love to hear from you!
* A fictional character representing the experience of many consumers in Tanzania.
1. See for example this VoxDevLit review.
2. M-Pesa, Tanzania’s largest mobile money provider, lists their fees here.
3. Fees are as of December 2022. Changes since then (including reductions in Tanzania’s mobile money levy) are not reflected here. Fees are a weighted average across major providers in each country at transaction values that roughly approximate the median transaction size in the country.